400 186 1886


svg是基于XML語法的圖像格式,全稱:Scalable Vector Graphics,即可縮放矢量圖。
svg圖片可以<img>加載。
svg可以繪制基本圖形,如:直線、圓形、矩形、多邊形、路徑等,下面就詳細介紹下。
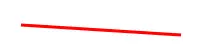
1.繪制線條
語法:<line/>,單標簽
基本屬性:
x1,起始點x坐標
y1,起始點y坐標
x2,結束點x坐標
y2,結束點y坐標
stroke-width:定義矩形的邊框寬度
stroke:定義矩形邊框的顏色
示例:
<!-- 繪制直線 -->
<svg width="300" height="30">
    <line x1="20" y1="10" x2="180" y2="20" stroke-width="3" stroke="red"/>
</svg>
- 1
- 2
- 3
- 4
- 5
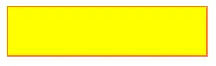
2.繪制矩形
語法:<rect/>,單標簽
屬性:
width:定義矩形寬度
height:定義矩形高度
fill:定義矩形的填充顏色
fill-opacity:定義填充顏色的不透明度,值:0 ~ 1
stroke-width:定義矩形的邊框寬度或輪廓厚度
stroke:定義矩形邊框的顏色
stroke-opacity:定義描邊顏色的不透明度,值:0 ~ 1
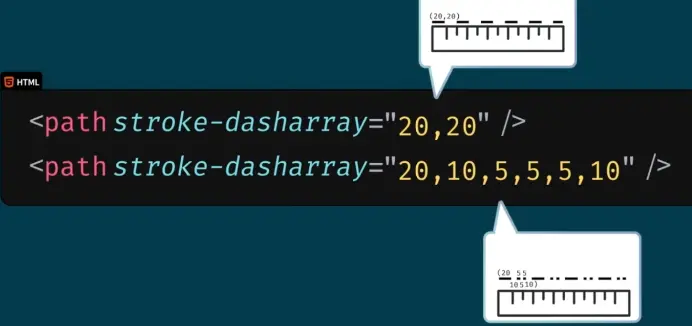
stroke-linecap:筆畫筆帽屬性,即線條末尾樣式,有:
butt:沒線帽,round:圓形,square:方形stroke-dasharray:虛線筆畫屬性,數字序列如:20,10,
x:起始點x坐標
y:起始點y坐標
rx:定義x軸方向的圓角長度
ry:定義y軸方向的圓角長度
示例:
<svg>
   <rect width="200" height="50" fill="yellow"
    stroke-width="1" stroke="red"/>
</svg>
- 1
- 2
- 3
- 4
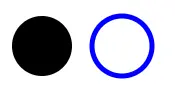
3.繪制圓形
語法:<circle/>,單標簽
屬性:
cx:定義圓形中心的x坐標,默認為坐標原點0
cy:定義圓形中心的y坐標,默認為坐標原點0
r:定義圓形的半徑
fill:定義矩形的填充顏色
fill-opacity:定義填充顏色的不透明度,值:0 ~ 1
stroke-width:定義矩形的邊框寬度
stroke:定義矩形邊框的顏色
stroke-opacity:定義描邊顏色的不透明度,值:0 ~ 1
示例:
<svg width="300" height="80">
    <circle cx="40" cy="40" r="30" />
    <circle cx="100" cy="40" r="30" fill="transparent"
        stroke-width="5" stroke="blue"/>
</svg>
- 1
- 2
- 3
- 4
- 5
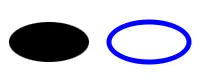
4.繪制橢圓形
語法:<ellipse/>,單標簽
除了有:fill、stroke、fill-opacity、stroke-width、stroke-opacity屬性外,還有屬性:
cx:橢圓中心的x坐標
cy:橢圓中心的y坐標
rx:定義橢圓水平半徑
ry:定義橢圓垂直半徑
示例:
<!-- 繪制橢圓 -->
<svg width="300" height="100">
    <ellipse cx="50" cy="40" rx="40" ry="20" />
    <ellipse cx="150" cy="40" rx="40" ry="20" fill="transparent"
        stroke-width="5" stroke="blue"/>
</svg>
- 1
- 2
- 3
- 4
- 5
- 6
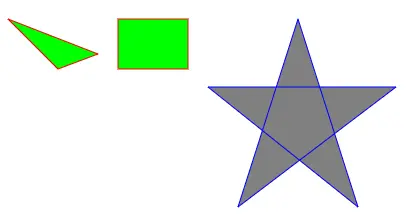
5.繪制多邊形
語法:<polygon/>,單標簽
同樣有fill、stroke、fill-opacity、stroke-width、stroke-opacity屬性外,還有屬性:
- points,多邊形每個頂點的x,y坐標,形式為:
100,20 150,35 160,70
<!-- 繪制多邊形 -->
<svg width="500" height="200">
    <!-- 三角形 -->
    <polygon points="10,10 100,45 60,60" fill="lime" stroke-width="1" stroke="red"/>
    <!-- 長方形 -->
    <polygon points="120,10 190,10 190,60 120,60" fill="lime" stroke-width="1" stroke="red"/>
    <!-- 五角星 -->
    <polygon points="300,10 240,198 398,78 210,78 360,198" fill="grey" stroke-width="1" stroke="blue"/>
</svg>
- 1
- 2
- 3
- 4
- 5
- 6
- 7
- 8
- 9
- 10
6.繪制多線條(折線)
語法:<polyline/>,單標簽
屬性同<polygon/>,參加上述。
繪制的區域不會進行封閉。
示例:
<!-- 繪制多邊形 -->
<svg width="500" height="200">
    <!-- 折線 -->
    <polyline points="10,10 100,45 150,20 180,60 210,10"
        fill="none" stroke-width="1" stroke="red"/>
</svg>
- 1
- 2
- 3
- 4
- 5
- 6
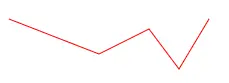
值得注意:繪制折線默認會有填充色,可通過設置fill屬性為none值去掉填充色。
7.繪制文本
基本語法:<text></text> ,雙標簽.
屬性:
x,文字起始點左下角x坐標
y,文字起始點左下角y坐標
fill,文字顏色
transform,文字變換,如:rotate、scale
font-size,文字大小
text-anchor,對齊方式,可選值有:
start、center、end

示例:
<!-- 繪制文本 -->
<svg width="500" height="110">
    <text x="20" y="35" fill="red" >0基礎學習HTML</text>
    <!-- 旋轉文字 -->
    <!-- rotate(20 200,20) 第一個為角度,后面為旋轉中心點坐標 缺省時為坐標原點0,0-->
    <text x="180" y="35" fill="blue" transform="rotate(20 200,20)">0基礎學習HTML</text>
    <!-- 多行文本 -->
    <text x="20" y="60">
        多行文本
        <tspan x="20" y="80">第一行文本</tspan>
        <tspan x="20" y="100">第二行文本</tspan>
    </text>
</svg>
<br>
<!-- 給文本添加超鏈接 -->
<svg width="500" height="50" xmlns:xlink="http://www.w3.org/1999/xlink">
    <a xlink:href="https:www.baidu.com" target="_blank">
        <text x="20" y="20" fill="blue">我時一個超鏈接文本</text>
    </a>
</svg>
- 1
- 2
- 3
- 4
- 5
- 6
- 7
- 8
- 9
- 10
- 11
- 12
- 13
- 14
- 15
- 16
- 17
- 18
- 19
- 20

8.繪制路徑
基本語法:<path/> 單標簽
重要屬性:
d,繪制屬性(draw的縮寫),常用的繪制命令有:
M命令,moveto縮寫,表示繪制的起點坐標,如:M20 10或M 20 10或M20,10或M 20,10;
L命令,lineto的縮寫,表示繪制一條直線,如:l50 10或者l 50 10,表示從上一個結束點到(50,10)繪制一條直線;
H命令,水平線到
V命令,垂直線到
C命令,curveto,三次貝塞爾曲線,如:C 150,-300 300,0 50,150 100,200
S命令,平滑曲線
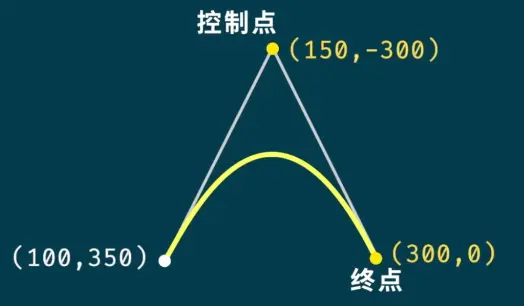
Q命令,繪制二次貝塞爾曲線,要定義控制點和終點坐標,如:q 150 -300 300 0,表示控制點是(150,-300),終點坐標(300,0),如圖示:
T命令,光滑二次貝塞爾曲線to
A命令,橢圓弧
Z命令,closepath閉合路徑
命令區分大小寫,大寫表示絕對定位,小寫表示相對定位,如圖示:

代碼示例:
<!-- 繪制path -->
<svg width="500" height="160">
<!-- 通過path繪制一個三角形 -->
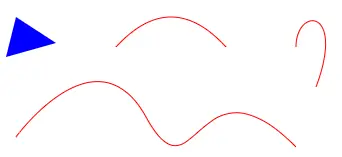
<path d="M20 10 L60 36 L10 50" fill="blue"/>
<!-- 繪制一條二次貝塞爾曲線 -->
<path d="M120 40 Q175 -20 230 40" fill="none" stroke="red"/>
<!-- 繪制一條三次貝塞爾曲線 -->
<path d="M300 40 C300,0 350,0 320,80 430,160" fill="none" stroke="red"/>
<!-- 繪制一條平滑曲線 -->
<path d="M20 130 S100,20 150,110 200,40 300,140" fill="none" stroke="red"/>
</svg>
- 1
- 2
- 3
- 4
- 5
- 6
- 7
- 8
- 9
- 10
- 11
9. 標簽分組
語法:<g></g>雙標簽
含義:使用該標簽對繪圖元素進行分組,可以在g標簽上添加公共屬性,如:fill
<!-- 通過g標簽對相同屬性的標簽進行分組 -->
<svg width="500" height="100">
    <g font-size="20" fill="blue" text-anchor="middle">
        <text x="20" y="20">一組</text>
        <text x="20" y="45">二組</text>
        <text x="20" y="70">三組</text>
    </g>
</svg>
- 1
- 2
- 3
- 4
- 5
- 6
- 7
- 8

10.模糊和陰影效果
模糊
語法:<filter id></filter>,經常定義在標簽defs下
模糊效果:<feGaussianBlur>,設置其屬性stdDeviation為一個值來實現,值越大越模糊,需要定義在filter標簽內部。
<!-- 模糊和陰影 -->
<svg width="500" height="120">
<defs>
<filter x="0" y="0" id="f1">
<feGaussianBlur stdDeviation="3"/>
</filter>
</defs>
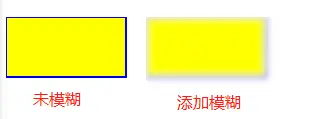
<!-- 未模糊效果 -->
<rect width="120" height="60" fill="yellow" stroke="blue" stroke-width="2"/>
<!-- 通過filter屬性實現模糊 -->
<rect x="140" width="120" height="60" fill="yellow" stroke="blue" stroke-width="2" filter="url(#f1)"/>
</svg>
- 1
- 2
- 3
- 4
- 5
- 6
- 7
- 8
- 9
- 10
- 11
- 12
陰影
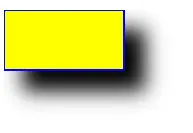
實現:feOffset和feBlend兩個濾鏡實現。兩個均為單標簽。
示例:
<!-- 陰影 -->
<defs>
    <filter x="0" y="0" width="200" height="200" id="f2">
    <!-- SourceAlpha給圖形制作一個黑色陰影-->
         <feOffset dx="20" dy="20" in="SourceAlpha"/>
         <!-- 給陰影添加一個模糊 -->
         <feGaussianBlur stdDeviation="10"/>
         <!-- SourceGraphic表示在偏移的圖像上混合原始圖像 -->
         <feBlend in="SourceGraphic"/>
    </filter>
</defs>
<rect y= "80" width="120" height="60" fill="yellow" stroke="blue" stroke-width="2" filter="url(#f2)"/>
- 1
- 2
- 3
- 4
- 5
- 6
- 7
- 8
- 9
- 10
- 11
- 12
11.線性漸變和徑向漸變
線性漸變
語法:<linearGradient></linearGradient>
屬性:
id,定義了漸變的唯一名稱
x1,漸變的起始x位置,百分比
y1,漸變的起始y位置,百分比
x2,漸變的結束x位置,百分比
y2,漸變的結束y位置,百分比
顏色用單標簽stop設置,如:
- offset:定義漸變顏色的開始和結束位置,其值是相對位置的百分比

- stop-color:用于定義漸變的顏色
<!-- 線性漸變和徑向漸變 -->
<svg width="500" height="200">
    <defs>
        <linearGradient x1="0%" y1="0%" x2="100%" y2="100%" id="l1">
            <stop offset="20%" stop-color="rgb(255,255,0)"/>
            <stop offset="100%" stop-color="rgb(255,0,0)"/>
        </linearGradient>
    </defs>
    <!-- 線性漸變 -->
    <rect width="120" height="60" fill="url(#l1)"/>
</svg>
- 1
- 2
- 3
- 4
- 5
- 6
- 7
- 8
- 9
- 10
- 11

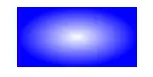
徑向漸變
語法:<radialGradient></radialGradient>雙標簽
屬性有:
id,定義了漸變的唯一名稱
cx,定義最外面圓x
cy,定義最外面圓x
r,定義最外面圓半徑
fx,定義了最里面的圓
fy,定義了最里面的圓

顏色也是使用stop實現
<!-- 徑向漸變 -->
<defs>
    <radialGradient id="r1" cx="50%" cy="50%" r="50%" fx="50%" fy="50%">
        <stop offset="0%" stop-color="rgb(255,255,255)"/>
        <stop offset="100%" stop-color="rgb(0,0,255)"/>
    </radialGradient>
</defs>
<rect x="200" width="120" height="60" fill="url(#r1)"/>
- 1
- 2
- 3
- 4
- 5
- 6
- 7
- 8